You are here

Azure Monitoring
Cloud - Azure Opspack
Microsoft Azure is a cloud computing service created by Microsoft that provides on-demand cloud services to individuals, companies and governments across the world for building, testing, deploying and managing applications and services through Microsoft managed data centers.
What You Can Monitor
This Opspack provides several Host Templates, allowing you to monitor various Azure Cloud Resources, such as Virtual Machines, Storage Accounts and Load Balancers, as well as many others.
Host Templates
The following Host Templates are provided within this Opspack. Expand each Host Template section below for information on included Service Checks and click 'Read More' to be taken to the relevant information page, including a full description and usage instructions
Cloud - Azure - Analysis Services Servers
add_circle| Service Check Name | Description | Default Thresholds (Warning, Critical) | UOM |
|---|---|---|---|
| Azure - Analysis Services Server - QPU | The average number of query processing units [Default Timespan = 5mins, Default Check Interval = 5mins] | N/A | N/A |
| Azure - Analysis Services Server - Memory | Average memory status, in bytes [Default Timespan = 5mins, Default Check Interval = 5mins] | N/A | B |
| Azure - Analysis Services Server - Connections | Average number of connection requests by status [Default Timespan = 5mins, Default Check Interval = 5mins] | N/A | N/A |
| Azure - Analysis Services Server - Sessions | Current number of user sessions established [Default Timespan = 5mins, Default Check Interval = 5mins] | N/A | N/A |
Cloud - Azure - API Management Services
add_circle| Service Check Name | Description | Default Thresholds (Warning, Critical) | UOM |
|---|---|---|---|
| Azure - API Management Service - Requests | Total number of requests by status [Default Timespan = 5mins, Default Check Interval = 5mins] | N/A | N/A |
| Azure - API Management Service - Duration | Overall Duration of Gateway Requests in milliseconds [Default Timespan = 5mins, Default Check Interval = 5mins] | N/A | ms |
| Azure - API Management Service - Capacity | Utilization metric for ApiManagement service, in percent [Default Timespan = 5mins, Default Check Interval = 5mins] | capacity=70,90 | % |
Cloud - Azure - App Service Plans
add_circle| Service Check Name | Description | Default Thresholds (Warning, Critical) | UOM |
|---|---|---|---|
| Azure - App Service Plan - Percentages | CPU/Memory Percentage [Default Timespan = 5mins, Default Check Interval = 5mins] | cpu_percentage=70,90 memory_percentage=70,90 |
% |
| Azure - App Service Plan - Queue Length | Disk/Http Queue Length [Default Timespan = 5mins, Default Check Interval = 5mins] | N/A | N/A |
| Azure - App Service Plan - Bytes | Data in/Data out, in bytes [Default Timespan = 5mins, Default Check Interval = 5mins] | N/A | B |
Cloud - Azure - App Services
add_circle| Service Check Name | Description | Default Thresholds (Warning, Critical) | UOM |
|---|---|---|---|
| Azure - App Service - CPU Time | CPU Time, in seconds [Default Timespan = 5mins, Default Check Interval = 5mins] | N/A | s |
| Azure - App Service - Threads | Thread Count [Default Timespan = 5mins, Default Check Interval = 5mins] | N/A | N/A |
| Azure - App Service - Memory | Memory working set [Default Timespan = 5mins, Default Check Interval = 5mins] | N/A | B |
| Azure - App Service - Bytes | Data in/Data out, in bytes [Default Timespan = 5mins, Default Check Interval = 5mins] | N/A | B |
| Azure - App Service - Requests | Total number of requests [Default Timespan = 5mins, Default Check Interval = 5mins] | N/A | N/A |
| Azure - App Service - Response Time | Average Response Time [Default Timespan = 5mins, Default Check Interval = 5mins] | N/A | s |
Cloud - Azure - Backup
add_circle| Service Check Name | Description | Default Thresholds (Warning, Critical) | UOM |
|---|---|---|---|
| Azure - Backup and Site Recovery - Backup Jobs | The number and status of backup jobs and information on the erroneous ones [Default Timespan = 5mins, Default Check Interval = 5mins] | N/A | NA |
Cloud - Azure - Container Service Managed Clusters
add_circle| Service Check Name | Description | Default Thresholds (Warning, Critical) | UOM |
|---|---|---|---|
| Azure - Kube Node - Allocatable CPU Cores | Total number of available cpu cores in a managed cluster [Default Timespan = 5mins, Default Check Interval = 5mins] | N/A | N/A |
| Azure - Kube Node - Allocatable Memory | Total amount of available memory in a managed cluster [Default Timespan = 5mins, Default Check Interval = 5mins] | N/A | B |
| Azure - Kube Node - Status Condition | Statuses for various node conditions [Default Timespan = 5mins, Default Check Interval = 5mins] | N/A | N/A |
| Azure - Kube - Pods Ready | Number of pods in Ready state [Default Timespan = 5mins, Default Check Interval = 5mins] | N/A | N/A |
Cloud - Azure - DNS Zones
add_circle| Service Check Name | Description | Default Thresholds (Warning, Critical) | UOM |
|---|---|---|---|
| Azure - DNS Zone - Query Volume | Total number of Bytes transmitted within time period [Default Timespan = 240mins, Default Check Interval = 60mins] | N/A | N/A |
| Azure - DNS Zone - Record Set Count | Number of Record Sets in a DNS zone [Default Timespan = 240mins, Default Check Interval = 60mins] | N/A | N/A |
| Azure - DNS Zone - Record Set Capacity | Percent of Record Set capacity utilized by a DNS zone [Default Timespan = 240mins, Default Check Interval = 60mins] | record_set_capacity_utilization=70,90 | % |
Cloud - Azure - Elastic Pool
add_circle| Service Check Name | Description | Default Thresholds (Warning, Critical) | UOM |
|---|---|---|---|
| Azure - EP - Allocated Storage | The allocated data storage [Default Timespan = 5mins, Default Check Interval = 5mins] | N/A | B |
| Azure - EP - Allocated Storage Percent | The percentage of storage allocated [Default Timespan = 5mins, Default Check Interval = 5mins] | allocated_data_storage_percent=70,90 | % |
| Azure - EP - CPU Usage | The percentage of CPU being used [Default Timespan = 5mins, Default Check Interval = 5mins] | cpu_percent=70,90 | % |
| Azure - EP - CPU Used | The CPU limit and number of CPUs used for the elastic pool [Default Timespan = 5mins, Default Check Interval = 5mins] | N/A | N/A |
| Azure - EP - Data IO Percent | The data IO percentage [Default Timespan = 5mins, Default Check Interval = 5mins] | physical_data_read_percent=70,90 | % |
| Azure - EP - eDTU Usage Percent | The eDTU percentage used for the elastic pool [Default Timespan = 5mins, Default Check Interval = 5mins] | edtu_usage_percent=70,90 | % |
| Azure - EP - eDTU Used | The eDTU limit and eDTU used for the elastic pool [Default Timespan = 5mins, Default Check Interval = 5mins] | N/A | N/A |
| Azure - EP - Log IO Percent | The log IO percentage [Default Timespan = 5mins, Default Check Interval = 5mins] | log_write_percent=70,90 | % |
| Azure - EP - Process CPU Usage | CPU usage of the SQL DB process as a percentage [Default Timespan = 5mins, Default Check Interval = 5mins] | sqlserver_process_core_percent=70,90 | % |
| Azure - EP - Process Memory Usage | Memory usage of the SQL DB process as a percentage [Default Timespan = 5mins, Default Check Interval = 5mins] | sqlserver_process_memory_percent=70,90 | % |
| Azure - EP - Sessions Percent | The percentage of sessions used [Default Timespan = 5mins, Default Check Interval = 5mins] | sessions_percent=70,90 | % |
| Azure - EP - Storage Usage | The percentage of storage used [Default Timespan = 5mins, Default Check Interval = 5mins] | storage_percent=70,90 | % |
| Azure - EP - Storage Used | The amount of data space used [Default Timespan = 5mins, Default Check Interval = 5mins] | N/A | B |
| Azure - EP - Tempdb Percent | The Tempdb log used percentage [Default Timespan = 5mins, Default Check Interval = 5mins] | tempdb_log_used_percent=70,90 | % |
| Azure - EP - Tempdb Used | The Tempdb data size and log size [Default Timespan = 5mins, Default Check Interval = 5mins] | N/A | B |
| Azure - EP - Workers Percent | The percentage of workers [Default Timespan = 5mins, Default Check Interval = 5mins] | workers_percent=70,90 | % |
| Azure - EP - XTP Storage Percent | The percentage of XTP (in-memory OLTP) storage used [Default Timespan = 5mins, Default Check Interval = 5mins] | xtp_storage_percent=70,90 | % |
Cloud - Azure - Health Availability Status
add_circle| Service Check Name | Description | Default Thresholds (Warning, Critical) | UOM |
|---|---|---|---|
| Azure - Health Availability Status | The health status of all Azure resources in a given resource group [Default Timespan = 5mins, Default Check Interval = 5mins] | N/A | NA |
Cloud - Azure - Linux VMs
add_circle| Service Check Name | Description | Default Thresholds (Warning, Critical) | UOM |
|---|---|---|---|
| Azure - Linux VM - Memory | The percentage of used memory and the available memory in bytes [Default Timespan = 5mins, Default Check Interval = 5mins] | N/A | NA |
| Azure - Linux VM - Memory Swap Space | The percentage of swap space used [Default Timespan = 5mins, Default Check Interval = 5mins] | N/A | NA |
| Azure - Linux VM - Processor Time | The percentage of processor time [Default Timespan = 5mins, Default Check Interval = 5mins] | N/A | NA |
| Azure - Linux VM - Processor Privileged Time | The percentage of processor privileged time [Default Timespan = 5mins, Default Check Interval = 5mins] | N/A | NA |
| Azure - Linux VM - Logical Disk Space | The percentage of used logical disk space [Default Timespan = 5mins, Default Check Interval = 5mins] | N/A | NA |
| Azure - Linux VM - System Uptime | The system uptime [Default Timespan = 5mins, Default Check Interval = 5mins] | N/A | NA |
| Azure - Linux VM - Heartbeat | The time between the last two heartbeats [Default Timespan = 5mins, Default Check Interval = 5mins] | N/A | NA |
| Azure - Linux VM - Restarts | The number of restarts, and information on the user and command invoke history [Default Timespan = 1440mins, Default Check Interval = 1440mins] | N/A | NA |
| Azure - Linux VM - Shutdowns | The number of shutdowns, and information on the user and command invoke history [Default Timespan = 1440mins, Default Check Interval = 1440mins] | N/A | NA |
Cloud - Azure - Load Balancers
add_circle| Service Check Name | Description | Default Thresholds (Warning, Critical) | UOM |
|---|---|---|---|
| Azure - LB - Endpoint Availability | Availability of VIP (Virtual IP) and DIP (Dynamic IP) endpoints, based on probe results [Default Timespan = 5mins, Default Check Interval = 5mins] | N/A | N/A |
| Azure - LB - Packets Transmitted | Total number of Packets/SYN Packets transmitted within time period [Default Timespan = 5mins, Default Check Interval = 5mins] | N/A | N/A |
| Azure - LB - Bytes Count | Total number of Bytes transmitted within time period [Default Timespan = 5mins, Default Check Interval = 5mins] | N/A | B |
Cloud - Azure - MySQL Server
add_circle| Service Check Name | Description | Default Thresholds (Warning, Critical) | UOM |
|---|---|---|---|
| Azure - MySQL - Active Connections | The average number of active connections [Default Timespan = 5mins, Default Check Interval = 5mins] | N/A | N/A |
| Azure - MySQL - CPU Percent | The CPU usage [Default Timespan = 5mins, Default Check Interval = 5mins] | cpu_percent=70,90 | % |
| Azure - MySQL - Connections Failed | The the number of failed connections [Default Timespan = 5mins, Default Check Interval = 5mins] | N/A | N/A |
| Azure - MySQL - Memory Percent | The memory usage [Default Timespan = 5mins, Default Check Interval = 5mins] | memory_percent=70,90 | % |
| Azure - MySQL - Storage Limit | The average storage limit [Default Timespan = 5mins, Default Check Interval = 5mins] | N/A | B |
| Azure - MySQL - Storage Percent | The storage usage [Default Timespan = 5mins, Default Check Interval = 5mins] | storage_percent=70,90 | % |
| Azure - MySQL - Storage Used | The storage usage in bytes [Default Timespan = 5mins, Default Check Interval = 5mins] | N/A | B |
| Azure - MySQL - IO Consumption Percent | The average IO consumption [Default Timespan = 5mins, Default Check Interval = 5mins] | io_consumption_percent=70,90 | % |
| Azure - MySQL - Server Log Storage Percent | The average server log storage usage percentage [Default Timespan = 5mins, Default Check Interval = 5mins] | serverlog_storage_percent=70,90 | % |
| Azure - MySQL - Server Log Storage Used | The average server log storage usage [Default Timespan = 5mins, Default Check Interval = 5mins] | N/A | B |
| Azure - MySQL - Server Log Storage Limit | The average server log storage limit [Default Timespan = 5mins, Default Check Interval = 5mins] | N/A | B |
| Azure - MySQL - Replication Lag | The average replication lag in seconds [Default Timespan = 5mins, Default Check Interval = 5mins] | N/A | s |
| Azure - MySQL - Backup Storage Used | The average backup storage usage [Default Timespan = 15mins, Default Check Interval = 15mins] | N/A | B |
| Azure - MySQL - Network Out | The number of bytes sent across active connections [Default Timespan = 5mins, Default Check Interval = 5mins] | N/A | B |
| Azure - MySQL - Network In | The number of bytes received across active connections [Default Timespan = 5mins, Default Check Interval = 5mins] | N/A | B |
Cloud - Azure - Network Watcher - Connection Monitors
add_circle| Service Check Name | Description | Default Thresholds (Warning, Critical) | UOM |
|---|---|---|---|
| Azure - Connection Monitors - Checks Failed Percent | The percent of checks failed for a connection monitor. Depending on the protocol used in the test configuration, connection monitor runs a series of checks for the source-destination pair. For HTTP, the service calculates the number of HTTP responses that returned a valid response code. If you use TCP or ICMP, the service calculates the packet-loss percentage to determine the percentage of failed checks. [Default Timespan = 5mins, Default Check Interval = 5mins] | checks_failed_percent=10,30 | % |
| Azure - Connection Monitors - Round Trip Time | The round trip time in milliseconds. Depending on the protocol used in the test configuration, connection monitor runs a series of checks for the source-destination pair. For HTTP, to calculate RTT, the service measures the time between a HTTP Call and the response. If you use TCP or ICMP, to calculate RTT, the service measures the time taken to receive the acknowledgement (ACK) for the packets that were sent. [Default Timespan = 5mins, Default Check Interval = 5mins] | N/A | ms |
| Azure - Connection Monitors - Test Result | The test result for the connection monitor. Depending on the data that the checks return, tests can have the following states; Pass: Actual values for the percentage of failed checks and RTT are within the specific thresholds. Fail: Actual values for the percentage of failed checks or RTT exceed the specific thresholds. Warning: Actual values for the percentage of failed checks or RTT are more than 80% of the threshold. Indeterminate: No data in the Log Analytics workspace. [Default Timespan = 5mins, Default Check Interval = 5mins] | N/A | N/A |
Cloud - Azure - Network Watcher - Classic Connection Monitors
add_circle| Service Check Name | Description | Default Thresholds (Warning, Critical) | UOM |
|---|---|---|---|
| Azure - Network Watcher - Connection Monitors | If any Connection Monitors for the Network Watcher have a Monitoring Status of either 'Stopped' or 'NotStarted' then display them up to the display maximum [Default Timespan = 5mins, Default Check Interval = 5mins] | N/A | NA |
Cloud - Azure - Network Watcher - VM Connectivity
add_circle| Service Check Name | Description | Default Thresholds (Warning, Critical) | UOM |
|---|---|---|---|
| Azure - Network Watcher - VM Connectivity | Check the status of TCP connection from a source VM to a target VM in Azure via a Network Watcher [Default Timespan = 5mins, Default Check Interval = 5mins] | N/A | NA |
Cloud - Azure - Network Watcher - VM Security Rules
add_circle| Service Check Name | Description | Default Thresholds (Warning, Critical) | UOM |
|---|---|---|---|
| Azure - Network Watcher - VM Security Rules | Display the list of network security rules for a VM if there are fewer rules than the display maximum, otherwise display the number of rules. Returns a warning when the total rule count is NOT equal to the warning threshold [Default Timespan = 5mins, Default Check Interval = 5mins] | N/A | NA |
Cloud - Azure - Network Watcher - VNG Troubleshooting
add_circle| Service Check Name | Description | Default Thresholds (Warning, Critical) | UOM |
|---|---|---|---|
| Azure - Network Watcher - VNG Troubleshooting | Check the status of the last troubleshooting results for a target resource [Default Timespan = 5mins, Default Check Interval = 5mins] | N/A | NA |
Cloud - Azure - PostgreSQL server
add_circle| Service Check Name | Description | Default Thresholds (Warning, Critical) | UOM |
|---|---|---|---|
| Azure - PostgreSQL - Active Connections | The number of active connections currently connected to the database [Default Timespan = 5mins, Default Check Interval = 5mins] | N/A | N/A |
| Azure - PostgreSQL - CPU Percent | The CPU usage of the database server [Default Timespan = 5mins, Default Check Interval = 5mins] | cpu_percent=70,90 | % |
| Azure - PostgreSQL - IO Consumption Percent | The amount of I/O resources being consumed [Default Timespan = 5mins, Default Check Interval = 5mins] | io_consumption_percent=70,90 | % |
| Azure - PostgreSQL - Memory Percent | The current memory usage of the database [Default Timespan = 5mins, Default Check Interval = 5mins] | memory_percent=70,90 | % |
| Azure - PostgreSQL - Storage Limit | The limit of hard disk space the database has been allocated [Default Timespan = 5mins, Default Check Interval = 5mins] | N/A | B |
| Azure - PostgreSQL - Storage Percent | The hard disk usage of the database [Default Timespan = 5mins, Default Check Interval = 5mins] | storage_percent=70,90 | % |
| Azure - PostgreSQL - Storage Used | The hard disk storage currently used [Default Timespan = 5mins, Default Check Interval = 5mins] | N/A | B |
| Azure - PostgreSQL - Server Log Storage Percent | The average server log storage usage percentage [Default Timespan = 5mins, Default Check Interval = 5mins] | serverlog_storage_percent=70,90 | % |
| Azure - PostgreSQL - Server Log Storage Used | The average server log storage used [Default Timespan = 5mins, Default Check Interval = 5mins] | N/A | B |
| Azure - PostgreSQL - Server Log Storage Limit | The average server log storage limit [Default Timespan = 5mins, Default Check Interval = 5mins] | N/A | B |
| Azure - PostgreSQL - Network In | The number of bytes received across active connections [Default Timespan = 5mins, Default Check Interval = 5mins] | N/A | B |
| Azure - PostgreSQL - Network Out | The number of bytes sent across active connections [Default Timespan = 5mins, Default Check Interval = 5mins] | N/A | B |
| Azure - PostgreSQL - Backup Storage Used | The average backup storage used [Default Timespan = 30mins, Default Check Interval = 30mins] | N/A | B |
| Azure - PostgreSQL - Replica Lag Delay in Seconds | The maximum replica lag in seconds [Default Timespan = 5mins, Default Check Interval = 5mins] | N/A | s |
| Azure - PostgreSQL - Replica Lag Delay in Bytes | The maximum replica lag in bytes [Default Timespan = 5mins, Default Check Interval = 5mins] | N/A | B |
| Azure - PostgreSQL - Connections Failed | The number of failed connection attempts to the database [Default Timespan = 5mins, Default Check Interval = 5mins] | N/A | N/A |
Cloud - Azure - Redis
add_circle| Service Check Name | Description | Default Thresholds (Warning, Critical) | UOM |
|---|---|---|---|
| Azure - Redis - Cache Bytes | The number of cache read and write bytes per second [Default Timespan = 5mins, Default Check Interval = 5mins] | N/A | B/s |
| Azure - Redis - Cache Requests | The number of cache hits and misses [Default Timespan = 5mins, Default Check Interval = 5mins] | N/A | N/A |
| Azure - Redis - Commands | The number of commands processed [Default Timespan = 5mins, Default Check Interval = 5mins] | N/A | N/A |
| Azure - Redis - Connected Clients | The maximum number of connected clients [Default Timespan = 5mins, Default Check Interval = 5mins] | N/A | N/A |
| Azure - Redis - CPU Usage | The CPU usage as a percentage [Default Timespan = 5mins, Default Check Interval = 5mins] | percent_processor_time=70,90 | % |
| Azure - Redis - Keys | The number of keys [Default Timespan = 5mins, Default Check Interval = 5mins] | N/A | N/A |
| Azure - Redis - Memory Usage | The memory usage as a percentage [Default Timespan = 5mins, Default Check Interval = 5mins] | used_memory_percentage=70,90 | % |
| Azure - Redis - Memory Used | The memory allocated to Redis (RSS) and used by Redis [Default Timespan = 5mins, Default Check Interval = 5mins] | N/A | B |
| Azure - Redis - Memory Used Ratio | The ratio of memory allocated to Redis to memory being used by Redis [Default Timespan = 5mins, Default Check Interval = 5mins] | N/A | N/A |
| Azure - Redis - Server Load | The maximum percentage load on the server [Default Timespan = 5mins, Default Check Interval = 5mins] | server_load=70,90 | % |
Cloud - Azure - Site Recovery
add_circle| Service Check Name | Description | Default Thresholds (Warning, Critical) | UOM |
|---|---|---|---|
| Azure - Backup and Site Recovery - Recovery Events | The number and status of Azure Recovery Services Replication Events [Default Timespan = 5mins, Default Check Interval = 5mins] | N/A | NA |
| Azure - Backup and Site Recovery - Replicated Items | The number of items covered by Azure Recovery Vault Replication [Default Timespan = 5mins, Default Check Interval = 5mins] | N/A | N/A |
| Azure - Backup and Site Recovery - Recovery Jobs | The number and status of Azure Recovery Services Replication Jobs [Default Timespan = 5mins, Default Check Interval = 5mins] | N/A | NA |
| Azure - Backup and Site Recovery - Vault Health | The health status of an Azure Recovery Services Vault [Default Timespan = 5mins, Default Check Interval = 5mins] | N/A | NA |
Cloud - Azure - SQL - DTU
add_circle| Service Check Name | Description | Default Thresholds (Warning, Critical) | UOM |
|---|---|---|---|
| Azure - SQL - DTU - Allocated Storage | The allocated data storage [Default Timespan = 5mins, Default Check Interval = 5mins] | N/A | B |
| Azure - SQL - DTU - Connections | The number of successful, failed and blocked connections [Default Timespan = 5mins, Default Check Interval = 5mins] | N/A | N/A |
| Azure - SQL - DTU - CPU Usage | The CPU usage of the database [Default Timespan = 5mins, Default Check Interval = 5mins] | cpu_percent=70,90 | % |
| Azure - SQL - DTU - Data IO Percent | The data IO percentage [Default Timespan = 5mins, Default Check Interval = 5mins] | physical_data_read_percent=70,90 | % |
| Azure - SQL - DTU - Deadlocks | The number of deadlocks [Default Timespan = 5mins, Default Check Interval = 5mins] | N/A | N/A |
| Azure - SQL - DTU - DTU Usage Percent | The DTU usage percentage [Default Timespan = 5mins, Default Check Interval = 5mins] | dtu_consumption_percent=70,90 | % |
| Azure - SQL - DTU - DTU Used | The DTU limit and number of DTUs used [Default Timespan = 5mins, Default Check Interval = 5mins] | N/A | N/A |
| Azure - SQL - DTU - Log IO Percent | The log IO percentage [Default Timespan = 5mins, Default Check Interval = 5mins] | log_write_percent=70,90 | % |
| Azure - SQL - DTU - Process CPU Usage | The CPU usage for the SQL Server process [Default Timespan = 5mins, Default Check Interval = 5mins] | sqlserver_process_core_percent=70,90 | % |
| Azure - SQL - DTU - Process Memory Usage | The memory usage for the SQL Server process [Default Timespan = 5mins, Default Check Interval = 5mins] | sqlserver_process_memory_percent=70,90 | % |
| Azure - SQL - DTU - Sessions Percent | The percentage of sessions [Default Timespan = 5mins, Default Check Interval = 5mins] | sessions_percent=70,90 | % |
| Azure - SQL - DTU - Storage Percent | The percentage of data space used and XTP (in-memory OLTP) storage used [Default Timespan = 5mins, Default Check Interval = 5mins] | storage_percent=70,90 xtp_storage_percent=70,90 |
% |
| Azure - SQL - DTU - Storage Used | The amount of data space used. [Default Timespan = 5mins, Default Check Interval = 5mins] | N/A | B |
| Azure - SQL - DTU - Tempdb Percent | The Tempdb log used percentage [Default Timespan = 5mins, Default Check Interval = 5mins] | tempdb_log_used_percent=70,90 | % |
| Azure - SQL - DTU - Tempdb Used | The Tempdb data size and log size [Default Timespan = 5mins, Default Check Interval = 5mins] | N/A | B |
| Azure - SQL - DTU - Workers Percent | The percentage of workers [Default Timespan = 5mins, Default Check Interval = 5mins] | workers_percent=70,90 | % |
Cloud - Azure - SQL - DWU
add_circle| Service Check Name | Description | Default Thresholds (Warning, Critical) | UOM |
|---|---|---|---|
| Azure - SQL - DWU - Connections | The number of successful, failed and blocked connections [Default Timespan = 5mins, Default Check Interval = 5mins] | N/A | N/A |
| Azure - SQL - DWU - CPU Usage | The CPU usage of the data warehouse [Default Timespan = 5mins, Default Check Interval = 5mins] | cpu_percent=70,90 | % |
| Azure - SQL - DWU - Data IO Percent | The data IO percentage [Default Timespan = 5mins, Default Check Interval = 5mins] | physical_data_read_percent=70,90 | % |
| Azure - SQL - DWU - DWU Cache Percent | The cache hit and cache used percentage [Default Timespan = 5mins, Default Check Interval = 5mins] | cache_hit_percent=70,90 cache_used_percent=70,90 |
% |
| Azure - SQL - DWU - DWU Usage Percent | The DWU consumption usage of the data warehouse [Default Timespan = 5mins, Default Check Interval = 5mins] | dwu_consumption_percent=70,90 | % |
| Azure - SQL - DWU - DWU Used | The DWU limit and number of DWUs used [Default Timespan = 5mins, Default Check Interval = 5mins] | N/A | N/A |
| Azure - SQL - DWU - Local Tempdb Percent | The local Tempdb log used percentage [Default Timespan = 5mins, Default Check Interval = 5mins] | local_tempdb_usage_percent=70,90 | % |
| Azure - SQL - DWU - Memory Usage | The memory usage of the data warehouse [Default Timespan = 5mins, Default Check Interval = 5mins] | memory_usage_percent=70,90 | % |
Cloud - Azure - SQL - Hyperscale
add_circle| Service Check Name | Description | Default Thresholds (Warning, Critical) | UOM |
|---|---|---|---|
| Azure - SQL - Hyperscale - Allocated Storage | The allocated data storage [Default Timespan = 5mins, Default Check Interval = 5mins] | N/A | B |
| Azure - SQL - Hyperscale - Connections | The number of successful, failed and blocked connections [Default Timespan = 5mins, Default Check Interval = 5mins] | N/A | N/A |
| Azure - SQL - Hyperscale - CPU Usage | The CPU usage of the database [Default Timespan = 5mins, Default Check Interval = 5mins] | cpu_percent=70,90 | % |
| Azure - SQL - Hyperscale - CPU Used | The CPU limit and number of CPUs used [Default Timespan = 60mins, Default Check Interval = 60mins] | N/A | N/A |
| Azure - SQL - Hyperscale - Data IO Percent | The data IO percentage [Default Timespan = 5mins, Default Check Interval = 5mins] | physical_data_read_percent=70,90 | % |
| Azure - SQL - Hyperscale - Deadlocks | The number of deadlocks [Default Timespan = 5mins, Default Check Interval = 5mins] | N/A | N/A |
| Azure - SQL - Hyperscale - Log IO Percent | The log IO percentage [Default Timespan = 5mins, Default Check Interval = 5mins] | log_write_percent=70,90 | % |
| Azure - SQL - Hyperscale - Process CPU Usage | The CPU usage for the SQL Server process [Default Timespan = 5mins, Default Check Interval = 5mins] | sqlserver_process_core_percent=70,90 | % |
| Azure - SQL - Hyperscale - Process Memory Usage | The memory usage for the SQL Server process [Default Timespan = 5mins, Default Check Interval = 5mins] | sqlserver_process_memory_percent=70,90 | % |
| Azure - SQL - Hyperscale - Sessions Percent | The percentage of sessions [Default Timespan = 5mins, Default Check Interval = 5mins] | sessions_percent=70,90 | % |
| Azure - SQL - Hyperscale - Tempdb Percent | The Tempdb log used percentage [Default Timespan = 5mins, Default Check Interval = 5mins] | tempdb_log_used_percent=70,90 | % |
| Azure - SQL - Hyperscale - Tempdb Used | The Tempdb data size and log size [Default Timespan = 5mins, Default Check Interval = 5mins] | N/A | B |
| Azure - SQL - Hyperscale - Workers Percent | The percentage of workers [Default Timespan = 5mins, Default Check Interval = 5mins] | workers_percent=70,90 | % |
| Azure - SQL - Hyperscale - XTP Storage Percent | The percentage of XTP (in-memory OLTP) storage used [Default Timespan = 5mins, Default Check Interval = 5mins] | xtp_storage_percent=70,90 | % |
Cloud - Azure - SQL - Serverless
add_circle| Service Check Name | Description | Default Thresholds (Warning, Critical) | UOM |
|---|---|---|---|
| Azure - SQL - Serverless - Allocated Storage | The allocated data storage [Default Timespan = 5mins, Default Check Interval = 5mins] | N/A | B |
| Azure - SQL - Serverless - App CPU Billed | The billed app CPU usage [Default Timespan = 5mins, Default Check Interval = 5mins] | N/A | N/A |
| Azure - SQL - Serverless - App CPU Usage | The app CPU usage [Default Timespan = 5mins, Default Check Interval = 5mins] | app_cpu_percent=70,90 | % |
| Azure - SQL - Serverless - App Memory Usage | The app memory usage [Default Timespan = 5mins, Default Check Interval = 5mins] | app_memory_percent=70,90 | % |
| Azure - SQL - Serverless - Connections | The number of successful, failed and blocked connections [Default Timespan = 5mins, Default Check Interval = 5mins] | N/A | N/A |
| Azure - SQL - Serverless - CPU Usage | The CPU usage of the database [Default Timespan = 5mins, Default Check Interval = 5mins] | cpu_percent=70,90 | % |
| Azure - SQL - Serverless - CPU Used | The CPU limit and number of CPUs used [Default Timespan = 60mins, Default Check Interval = 60mins] | N/A | N/A |
| Azure - SQL - Serverless - Data IO Percent | The data IO percentage [Default Timespan = 5mins, Default Check Interval = 5mins] | physical_data_read_percent=70,90 | % |
| Azure - SQL - Serverless - Deadlocks | The number of deadlocks [Default Timespan = 5mins, Default Check Interval = 5mins] | N/A | N/A |
| Azure - SQL - Serverless - Log IO Percent | The log IO percentage [Default Timespan = 5mins, Default Check Interval = 5mins] | log_write_percent=70,90 | % |
| Azure - SQL - Serverless - Process CPU Usage | The CPU usage for the SQL Server process [Default Timespan = 5mins, Default Check Interval = 5mins] | sqlserver_process_core_percent=70,90 | % |
| Azure - SQL - Serverless - Process Memory Usage | The memory usage for the SQL Server process [Default Timespan = 5mins, Default Check Interval = 5mins] | sqlserver_process_memory_percent=70,90 | % |
| Azure - SQL - Serverless - Sessions Percent | The percentage of sessions [Default Timespan = 5mins, Default Check Interval = 5mins] | sessions_percent=70,90 | % |
| Azure - SQL - Serverless - Storage Percent | The percentage of data space used and XTP (in-memory OLTP) storage used [Default Timespan = 5mins, Default Check Interval = 5mins] | storage_percent=70,90 xtp_storage_percent=70,90 |
% |
| Azure - SQL - Serverless - Storage Used | The amount of data space used. [Default Timespan = 5mins, Default Check Interval = 5mins] | N/A | B |
| Azure - SQL - Serverless - Tempdb Percent | The Tempdb log used percentage [Default Timespan = 5mins, Default Check Interval = 5mins] | tempdb_log_used_percent=70,90 | % |
| Azure - SQL - Serverless - Tempdb Used | The Tempdb data size and log size [Default Timespan = 5mins, Default Check Interval = 5mins] | N/A | B |
| Azure - SQL - Serverless - Workers Percent | The percentage of workers [Default Timespan = 5mins, Default Check Interval = 5mins] | workers_percent=70,90 | % |
Cloud - Azure - SQL - vCore
add_circle| Service Check Name | Description | Default Thresholds (Warning, Critical) | UOM |
|---|---|---|---|
| Azure - SQL - vCore - Allocated Storage | The allocated data storage [Default Timespan = 5mins, Default Check Interval = 5mins] | N/A | B |
| Azure - SQL - vCore - Connections | The number of successful, failed and blocked connections [Default Timespan = 5mins, Default Check Interval = 5mins] | N/A | N/A |
| Azure - SQL - vCore - CPU Usage | The CPU usage of the database [Default Timespan = 5mins, Default Check Interval = 5mins] | cpu_percent=70,90 | % |
| Azure - SQL - vCore - CPU Used | The CPU limit and number of CPUs used [Default Timespan = 60mins, Default Check Interval = 60mins] | N/A | N/A |
| Azure - SQL - vCore - Data IO Percent | The data IO percentage [Default Timespan = 5mins, Default Check Interval = 5mins] | physical_data_read_percent=70,90 | % |
| Azure - SQL - vCore - Deadlocks | The number of deadlocks [Default Timespan = 5mins, Default Check Interval = 5mins] | N/A | N/A |
| Azure - SQL - vCore - Log IO Percent | The log IO percentage [Default Timespan = 5mins, Default Check Interval = 5mins] | log_write_percent=70,90 | % |
| Azure - SQL - vCore - Process CPU Usage | The CPU usage for the SQL Server process [Default Timespan = 5mins, Default Check Interval = 5mins] | sqlserver_process_core_percent=70,90 | % |
| Azure - SQL - vCore - Process Memory Usage | The memory usage for the SQL Server process [Default Timespan = 5mins, Default Check Interval = 5mins] | sqlserver_process_memory_percent=70,90 | % |
| Azure - SQL - vCore - Sessions Percent | The percentage of sessions [Default Timespan = 5mins, Default Check Interval = 5mins] | sessions_percent=70,90 | % |
| Azure - SQL - vCore - Storage Percent | The percentage of data space used and XTP (in-memory OLTP) storage used [Default Timespan = 5mins, Default Check Interval = 5mins] | storage_percent=70,90 xtp_storage_percent=70,90 |
% |
| Azure - SQL - vCore - Storage Used | The amount of data space used. [Default Timespan = 5mins, Default Check Interval = 5mins] | N/A | B |
| Azure - SQL - vCore - Tempdb Percent | The Tempdb log used percentage [Default Timespan = 5mins, Default Check Interval = 5mins] | tempdb_log_used_percent=70,90 | % |
| Azure - SQL - vCore - Tempdb Used | The Tempdb data size and log size [Default Timespan = 5mins, Default Check Interval = 5mins] | N/A | B |
| Azure - SQL - vCore - Workers Percent | The percentage of workers [Default Timespan = 5mins, Default Check Interval = 5mins] | workers_percent=70,90 | % |
Cloud - Azure - Storage Accounts
add_circle| Service Check Name | Description | Default Thresholds (Warning, Critical) | UOM |
|---|---|---|---|
| Azure - Storage Account - Capacity | The Account used capacity, in bytes [Default Timespan = 120mins, Default Check Interval = 60mins] | N/A | B |
| Azure - Storage Account - Availability | The percentage of availability for the storage service or the specified API operation [Default Timespan = 120mins, Default Check Interval = 60mins] | availability=30:,10: | % |
| Azure - Storage Account - Bytes | The amount of ingress/egress data, in bytes [Default Timespan = 120mins, Default Check Interval = 60mins] | N/A | B |
| Azure - Storage Account - Latency | The average latency/end-to-end latency used by Azure Storage to process a successsful request in milliseconds [Default Timespan = 120mins, Default Check Interval = 60mins] | N/A | ms |
| Azure - Storage Account - Blob Capacity | The amount of storage used by the storage account's Blob service in bytes [Default Timespan = 120mins, Default Check Interval = 60mins] | N/A | B |
| Azure - Storage Account - Blob Availability | The percentage of availability for the storage service or the specified API operation [Default Timespan = 1440mins, Default Check Interval = 1440mins] | availability=30:,10: | % |
| Azure - Storage Account - Blob Count | The number of Blob/containers in the storage account's Blob service [Default Timespan = 120mins, Default Check Interval = 60mins] | N/A | N/A |
| Azure - Storage Account - Blob Bytes | The amount of ingress/egress data, in bytes [Default Timespan = 1440mins, Default Check Interval = 1440mins] | N/A | B |
| Azure - Storage Account - Blob Latency | The average latency/end-to-end latency used by Azure Storage to process a successsful request in milliseconds [Default Timespan = 1440mins, Default Check Interval = 1440mins] | N/A | ms |
| Azure - Storage Account - Table Capacity | The amount of storage used by the storage account's Table service in bytes [Default Timespan = 120mins, Default Check Interval = 60mins] | N/A | B |
| Azure - Storage Account - Table Availability | The percentage of availability for the storage service or the specified API operation [Default Timespan = 120mins, Default Check Interval = 60mins] | availability=30:,10: | % |
| Azure - Storage Account - Table Count | The number of table/table entities in the storage account's Table service [Default Timespan = 120mins, Default Check Interval = 60mins] | N/A | N/A |
| Azure - Storage Account - Table Bytes | The amount of ingress/egress data, in bytes [Default Timespan = 120mins, Default Check Interval = 60mins] | N/A | B |
| Azure - Storage Account - Table Latency | The average latency/end-to-end latency used by Azure Storage to process a successsful request in milliseconds [Default Timespan = 120mins, Default Check Interval = 60mins] | N/A | ms |
| Azure - Storage Account - Queue Capacity | The amount of storage used by the storage account's Queue service in bytes [Default Timespan = 120mins, Default Check Interval = 60mins] | N/A | B |
| Azure - Storage Account - Queue Availability | The percentage of availability for the storage service or the specified API operation [Default Timespan = 120mins, Default Check Interval = 60mins] | availability=30:,10: | % |
| Azure - Storage Account - Queue Count | The number of queue/queue messages in the storage account's Queue service [Default Timespan = 120mins, Default Check Interval = 60mins] | N/A | N/A |
| Azure - Storage Account - Queue Bytes | The amount of ingress/egress data, in bytes [Default Timespan = 120mins, Default Check Interval = 60mins] | N/A | B |
| Azure - Storage Account - Queue Latency | The average latency/end-to-end latency used by Azure Storage to process a successsful request in milliseconds [Default Timespan = 120mins, Default Check Interval = 60mins] | N/A | ms |
| Azure - Storage Account - File Capacity | The amount of storage used by the storage account's File service in bytes [Default Timespan = 120mins, Default Check Interval = 60mins] | N/A | B |
| Azure - Storage Account - File Availability | The percentage of availability for the storage service or the specified API operation [Default Timespan = 1440mins, Default Check Interval = 1440mins] | availability=30:,10: | % |
| Azure - Storage Account - File Count | The number of file/file shares in the storage account's File service [Default Timespan = 120mins, Default Check Interval = 60mins] | N/A | N/A |
| Azure - Storage Account - File Bytes | The amount of ingress/egress data, in bytes [Default Timespan = 1440mins, Default Check Interval = 1440mins] | N/A | B |
| Azure - Storage Account - File Latency | The average latency/end-to-end latency used by Azure Storage to process a successsful request in milliseconds [Default Timespan = 1440mins, Default Check Interval = 1440mins] | N/A | ms |
Cloud - Azure - Virtual Machines
add_circle| Service Check Name | Description | Default Thresholds (Warning, Critical) | UOM |
|---|---|---|---|
| Azure - VM - Bytes Read | The number of bytes read by the VM [Default Timespan = 5mins, Default Check Interval = 5mins] | N/A | B |
| Azure - VM - Bytes Written | The number of bytes written by the VM [Default Timespan = 5mins, Default Check Interval = 5mins] | N/A | B |
| Azure - VM - Bytes Read Operations | The number of bytes read operations by the VM per second [Default Timespan = 5mins, Default Check Interval = 5mins] | N/A | per_second |
| Azure - VM - Bytes Write Operations | The number of bytes write operations by the VM per second [Default Timespan = 5mins, Default Check Interval = 5mins] | N/A | per_second |
| Azure - VM - Network In | The number of bytes received by the VM [Default Timespan = 5mins, Default Check Interval = 5mins] | N/A | B |
| Azure - VM - Network Out | The number of bytes sent by the VM [Default Timespan = 5mins, Default Check Interval = 5mins] | N/A | B |
| Azure - VM - Percentage CPU | The percentage CPU usage [Default Timespan = 5mins, Default Check Interval = 5mins] | percentage_cpu=70,90 | % |
Cloud - Azure - Virtual Machines Scale Sets
add_circle| Service Check Name | Description | Default Thresholds (Warning, Critical) | UOM |
|---|---|---|---|
| Azure - VMSS - Bytes Read | The number of bytes read by the VMSS [Default Timespan = 5mins, Default Check Interval = 5mins] | N/A | B |
| Azure - VMSS - Bytes Written | The number of bytes written by the VMSS [Default Timespan = 5mins, Default Check Interval = 5mins] | N/A | B |
| Azure - VMSS - Bytes Read Operations | The number of bytes read operations by the VMSS per second [Default Timespan = 5mins, Default Check Interval = 5mins] | N/A | per_second |
| Azure - VMSS - Bytes Write Operations | The number of bytes write operations by the VMSS per second [Default Timespan = 5mins, Default Check Interval = 5mins] | N/A | per_second |
| Azure - VMSS - Network In | The number of bytes received by the VMSS [Default Timespan = 5mins, Default Check Interval = 5mins] | N/A | B |
| Azure - VMSS - Network Out | The number of bytes sent by the VMSS [Default Timespan = 5mins, Default Check Interval = 5mins] | N/A | B |
| Azure - VMSS - Percentage CPU | The percentage CPU usage [Default Timespan = 5mins, Default Check Interval = 5mins] | percentage_cpu=70,90 | % |
Cloud - Azure - Virtual Machines Scale Sets VM
add_circle| Service Check Name | Description | Default Thresholds (Warning, Critical) | UOM |
|---|---|---|---|
| Azure - VMSSVM - Bytes Read | The number of bytes read by the VMSSVM [Default Timespan = 5mins, Default Check Interval = 5mins] | N/A | B |
| Azure - VMSSVM - Bytes Written | The number of bytes written by the VMSSVM [Default Timespan = 5mins, Default Check Interval = 5mins] | N/A | B |
| Azure - VMSSVM - Bytes Read Operations | The number of bytes read operations by the VMSSVM per second [Default Timespan = 5mins, Default Check Interval = 5mins] | N/A | per_second |
| Azure - VMSSVM - Bytes Write Operations | The number of bytes write operations by the VMSSVM per second [Default Timespan = 5mins, Default Check Interval = 5mins] | N/A | per_second |
| Azure - VMSSVM - Network In | The number of bytes received by the VMSSVM [Default Timespan = 5mins, Default Check Interval = 5mins] | N/A | B |
| Azure - VMSSVM - Network Out | The number of bytes sent by the VMSSVM [Default Timespan = 5mins, Default Check Interval = 5mins] | N/A | B |
| Azure - VMSSVM - Percentage CPU | The percentage CPU usage [Default Timespan = 5mins, Default Check Interval = 5mins] | percentage_cpu=70,90 | % |
Cloud - Azure - Virtual Network Gateways
add_circle| Service Check Name | Description | Default Thresholds (Warning, Critical) | UOM |
|---|---|---|---|
| Azure - Virtual Net Gateway - Tunnel Bandwidth | Average bandwidth of a tunnel in bytes per second [Default Timespan = 5mins, Default Check Interval = 5mins] | N/A | B/s |
| Azure - Virtual Net Gateway - Tunnel Bytes | Outgoing/Incoming bytes of a tunnel [Default Timespan = 5mins, Default Check Interval = 5mins] | N/A | B |
| Azure - Virtual Net Gateway - Tunnel Packets | Outgoing/Incoming packet count of a tunnel [Default Timespan = 5mins, Default Check Interval = 5mins] | N/A | N/A |
Cloud - Azure - VM Backups
add_circle| Service Check Name | Description | Default Thresholds (Warning, Critical) | UOM |
|---|---|---|---|
| Azure - VM Backup - Backup Status | The backup status of a Virtual Machine in Azure [Default Timespan = 5mins, Default Check Interval = 5mins] | N/A | NA |
Cloud - Azure - Windows VMs
add_circle| Service Check Name | Description | Default Thresholds (Warning, Critical) | UOM |
|---|---|---|---|
| Azure - Windows VM - Memory | The percentage of used memory and the available memory in bytes [Default Timespan = 5mins, Default Check Interval = 5mins] | N/A | NA |
| Azure - Windows VM - Processor Time | The percentage of processor time [Default Timespan = 5mins, Default Check Interval = 5mins] | N/A | NA |
| Azure - Windows VM - Processor Queue Length | The processor queue length [Default Timespan = 5mins, Default Check Interval = 5mins] | N/A | NA |
| Azure - Windows VM - Logical Disk Space | The percentage of free space and the amount of free space in bytes [Default Timespan = 5mins, Default Check Interval = 5mins] | N/A | NA |
| Azure - Windows VM - System Uptime | The system uptime [Default Timespan = 5mins, Default Check Interval = 5mins] | N/A | NA |
| Azure - Windows VM - Heartbeat | The time between the last two heartbeats [Default Timespan = 5mins, Default Check Interval = 5mins] | N/A | NA |
| Azure - Windows VM - Restarts | The number of restarts, and information on the user and comment history [Default Timespan = 1440mins, Default Check Interval = 1440mins] | N/A | NA |
| Azure - Windows VM - Shutdowns | The number of shutdowns, and information on the user and comment history [Default Timespan = 1440mins, Default Check Interval = 1440mins] | N/A | NA |
Setup Microsoft Azure for Monitoring
To monitor your Azure environment, you need to configure it for monitoring. This requires Administrator access on Azure.
You need to retrieve the following credentials, which will allow Opsview Monitor access to the metrics provided by Azure:
- Subscription ID
- Tenant/Directory ID
- Client/Application ID
- Secret Key
Follow the steps below to retrieve this information.
Step 1: Find the Subscription ID
The Subscription ID can be found in the Subscriptions section under the All services section in the Azure dashboard.


Step 2: Find the Tenant/Directory ID
The Tenant/Directory ID can be found in the Azure Active Directory section under the Properties section in the Azure dashboard.

Step 3: Find the Client/Application ID for your application
You need to create and register your application if you haven't already. For more information, refer to: Create an Azure Active Directory application
The Client/Application ID can be found in the Azure Active Directory section under the App registrations section in the Azure dashboard.

Step 4: Generate the Secret Key for your application
You will need to create a Secret Key for your application, once this has been created its value will be hidden, so save the value during creation.
To create the Secret Key, select your application from the list, select the Certificates and secrets section and then click on New client secret.
Specify a description and expiration date for your key and then click Add.

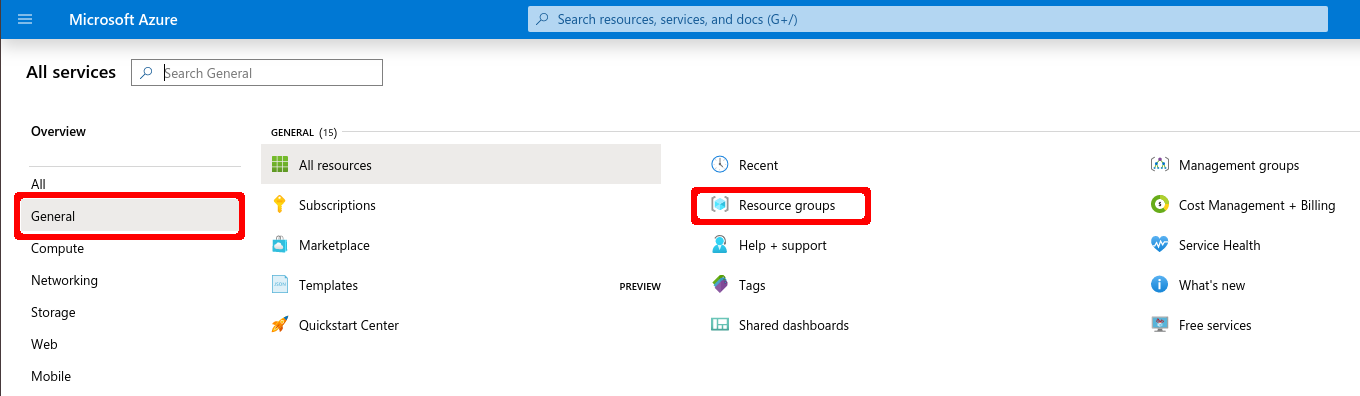
Step 5: Find the Resource Group
You will need the name of your Resource Group in order to monitor the resources inside of it. The Resource Groups can be found in the Resource Groups section, found in All services. Here we can find the names of Resource Groups that we have already created or create new ones.

Step 6: Find your Resource Name
You will need the name your Resource in order to monitor it. The Resources can be found in the All resources section, found in All services. Here we can find the names of the Resources that we have already created or create new ones.

Here you can see 3 different Resources with their names highlighted. Note that we don't require the details in the brackets that follow certain resources.
