Customizable Dashboards
View all of your monitoring metrics in interactive dashboards that are easy to create and maintain. Give your team the IT visibility they need.
ITRS acquires IP-Label. Read the press release.
View all of your monitoring metrics in interactive dashboards that are easy to create and maintain. Give your team the IT visibility they need.
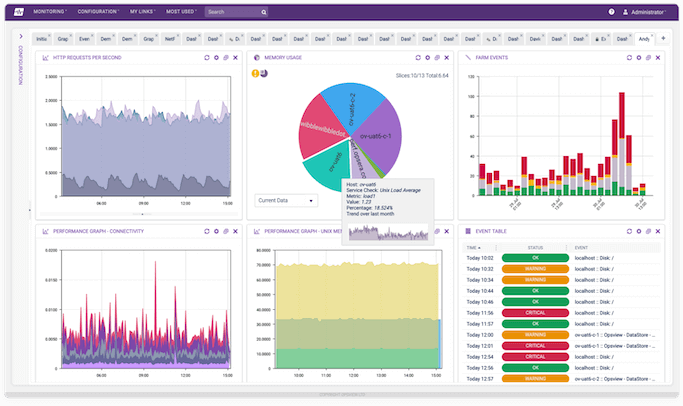
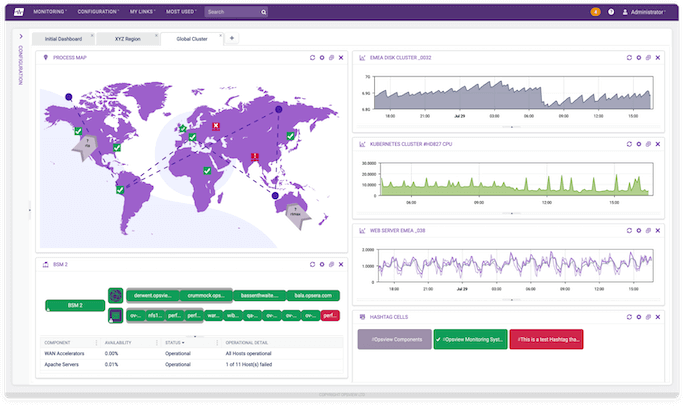
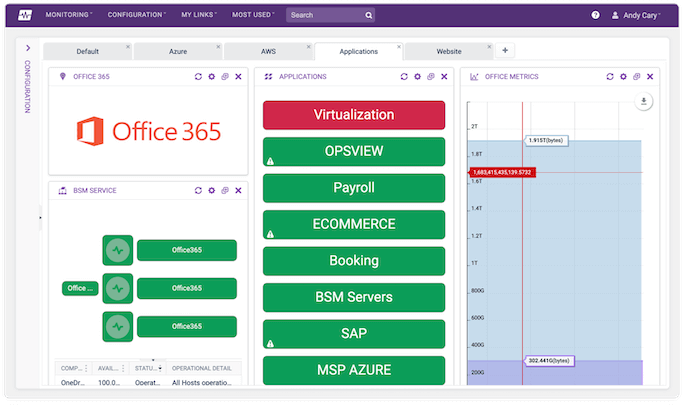
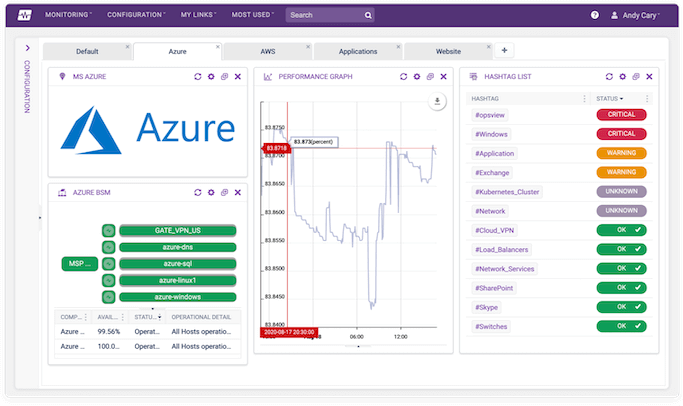
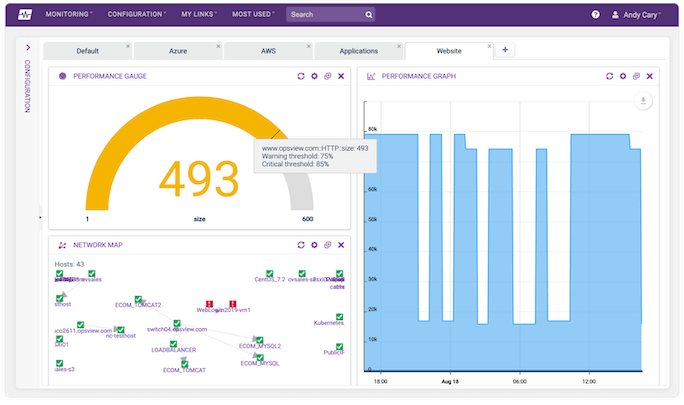
Dashboards allow you to view data from your entire IT estate in a single pane of glass. Dashlets are used to create customizable, resizable views that help with the analysis of ongoing events. These views are based on various elements of Opsview, such as Business Service Monitoring, Reporting, Events, Hashtags, Host Groups, and Graphs.
This Dashlet allows you to upload an image to Opsview and overlay the monitored data onto the image.
This Dashlet displays a visual representation of the health of the Service Checks within one or more Hashtags within Opsview. The size of the cell is proportional to the number of Service Checks within the given Hashtag in a certain state.
This Dashlet allows Users to add a graph to their Dashlet, in a similar view and format to that within the Graph Center and within the 'Investigate Mode' in 'Host Groups, Hosts and Services'.
This Dashlet allows you to see the hierarchy of the Hosts within your environment by showing the dependencies between Hosts (as defined by the administrator), and draws a spider diagram outlining the relationship between Hosts, along with a status indicator for each Host.
Join Opsview expert Neil Ferguson for a quick 4-minute tour of Opsview Dashboards.